Challenge
Challenge
Utility vegetation management runs on foot patrols and periodic LiDAR contracts. Both are slow, and neither produces evidence a non-GIS stakeholder can review. The question: how much of a corridor inventory can one drone flight produce?
Approach
Approach
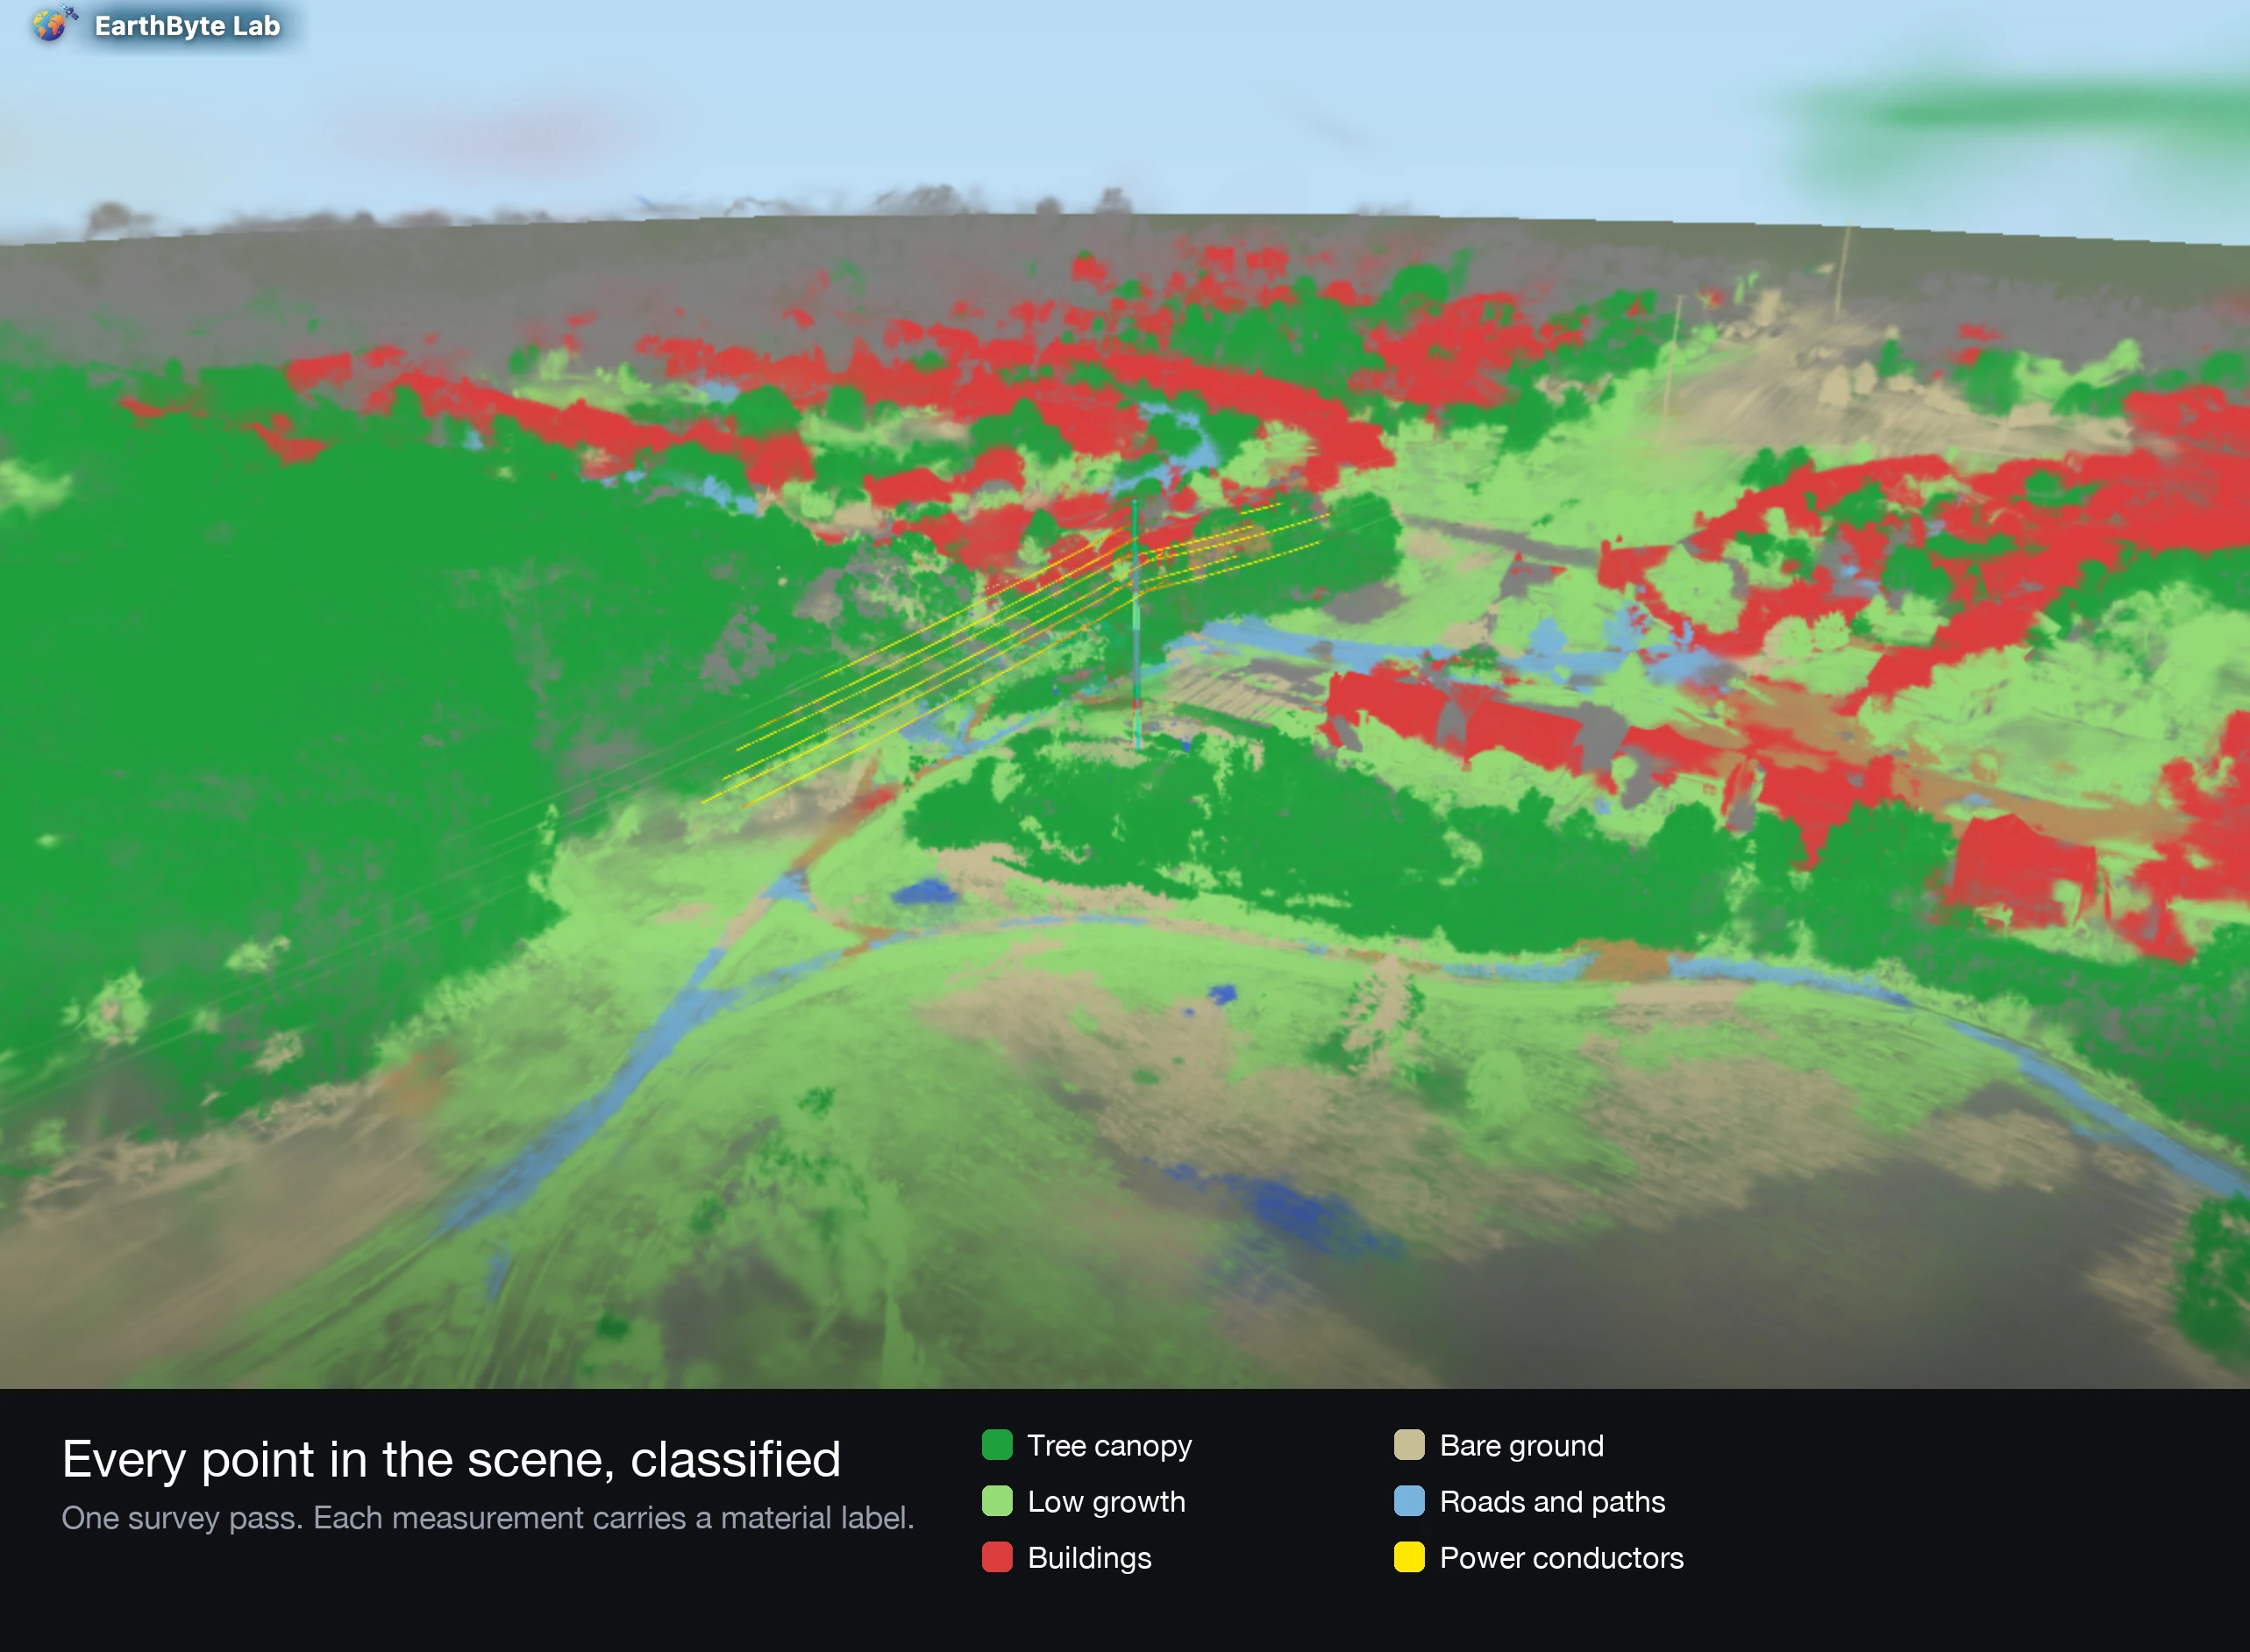
One aerial pass, processed through photogrammetry and 3D Gaussian splatting. Automated classification labelled canopy, low growth, buildings, bare ground, roads, and conductors. Clearance computation ran per span, separating energised phase conductors from grounded shield wires.
The scene
Open the corridor in your browser
This is the delivered scene from that flight. It loads on demand, and it shares by link.
Photoreal 3D Gaussian splat of a live transmission corridor, built from one drone pass. Drag to orbit and scroll to zoom; a toggle switches to the classified view, which labels canopy, low growth, buildings, bare ground, roads, and conductors. The case study reports the same results in text: 14 conductors identified, with vegetation clearance per span in metres.
Deliverables
What the client received
- Photoreal 3D scene, shareable by link, viewable in any modern browser
- Classified asset view, toggled on demand
- Conductor geometry, structure positions, and clearance measurements as structured data
- Written report leading with the spans that need attention
Outcome
Outcome
The system found 14 conductors and the supporting structure from one pass, each confirmed by two independent lines of evidence, with vegetation clearance reported per span in metres. The live scene is public at splats.earthbytelab.com. Stated limits: canopy surface, not bare earth under dense foliage; sub-metre clearance is not resolvable at every point on every span.
- 14
- Conductors identified from one pass
- per span
- Clearance reported in metres
- 1 URL
- Delivery format